Free LimeSurvey Reporting Plugin
Make your survey results easier to explore and share. The Free LimeSurvey Reporting Plugin adds online reporting to your LimeSurvey installation, helping you present feedback from evaluations, questionnaires, and other surveys in a clear visual format. Reports use completed responses directly from your LimeSurvey database. Whenever a report is opened or reloaded, it reflects the latest completed responses—without exporting data, transferring files, or maintaining a separate reporting tool.
Charts and text responses in one report
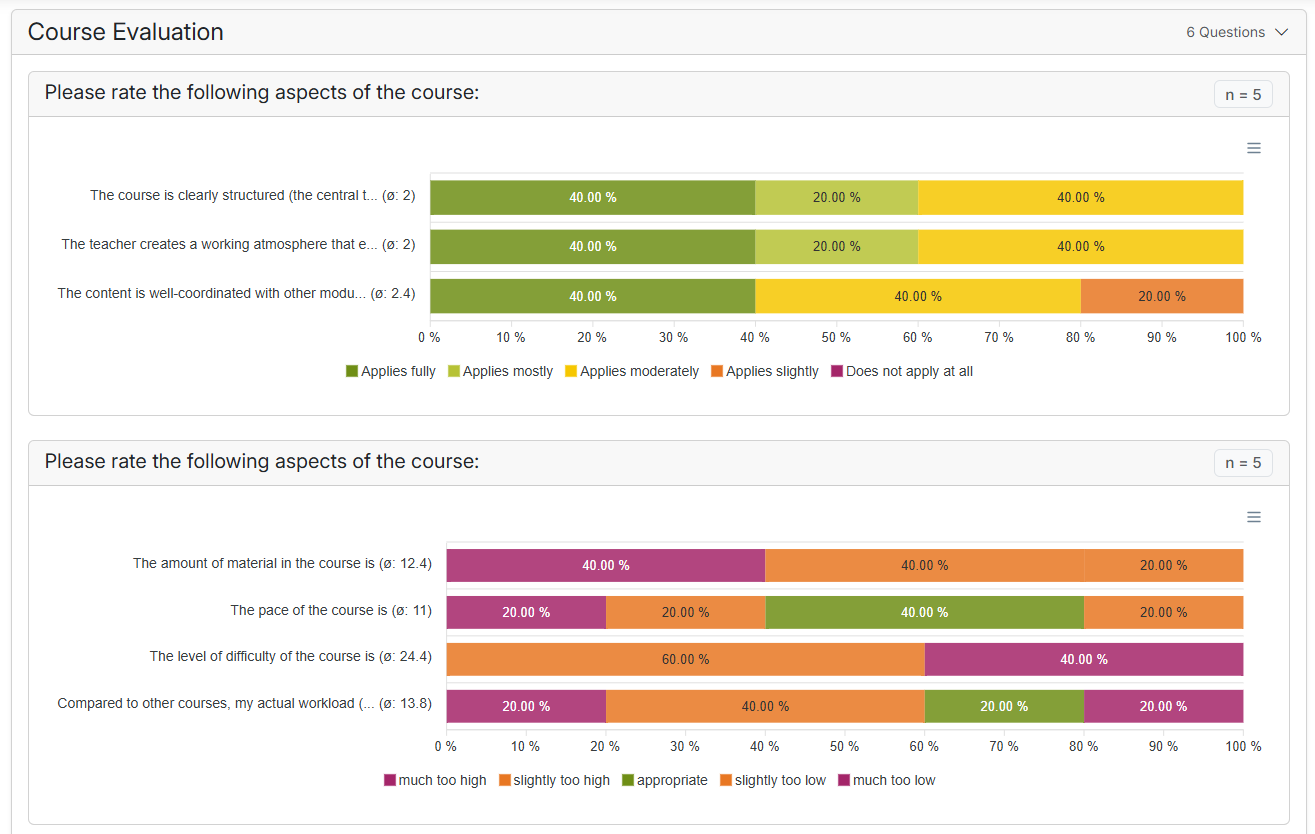
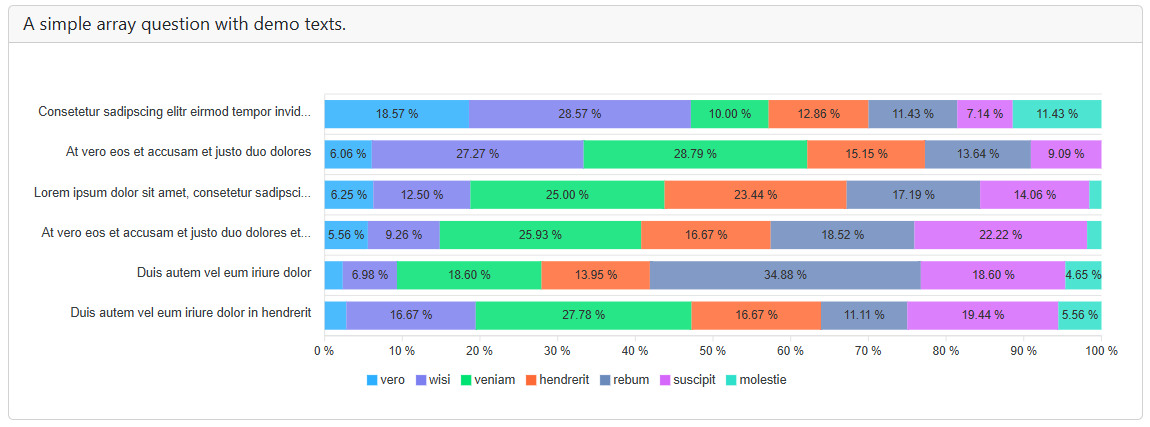
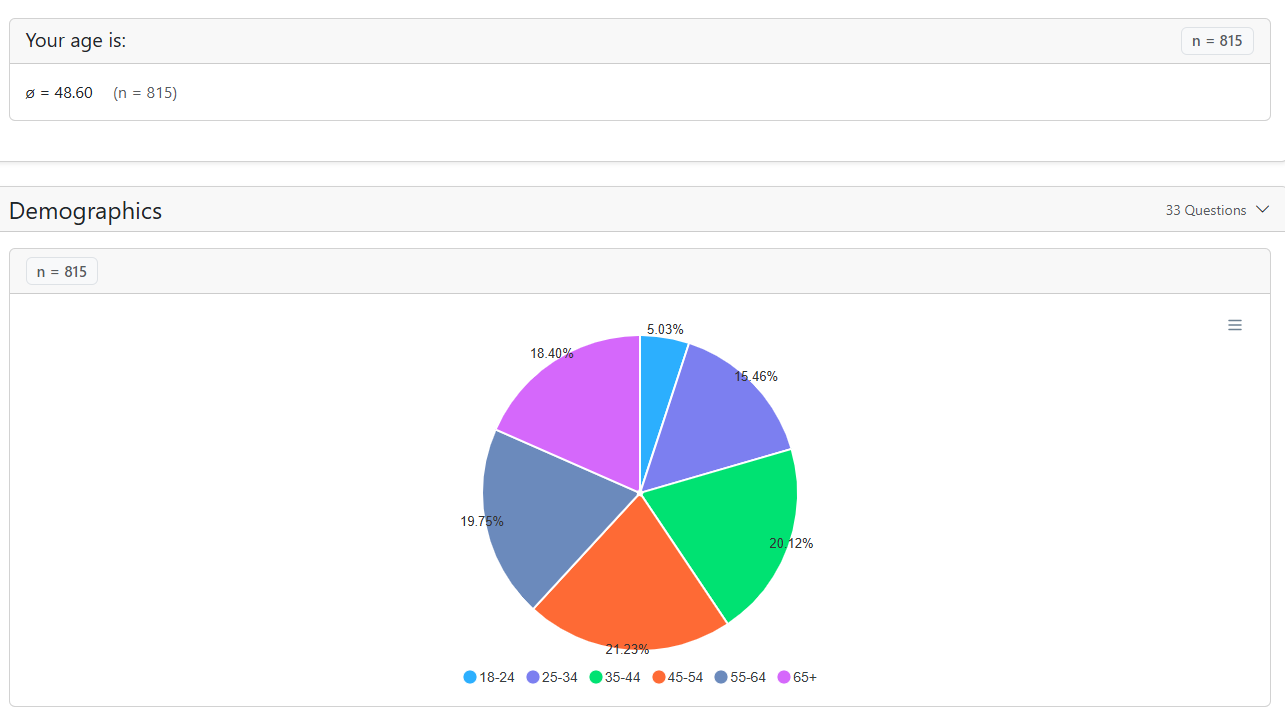
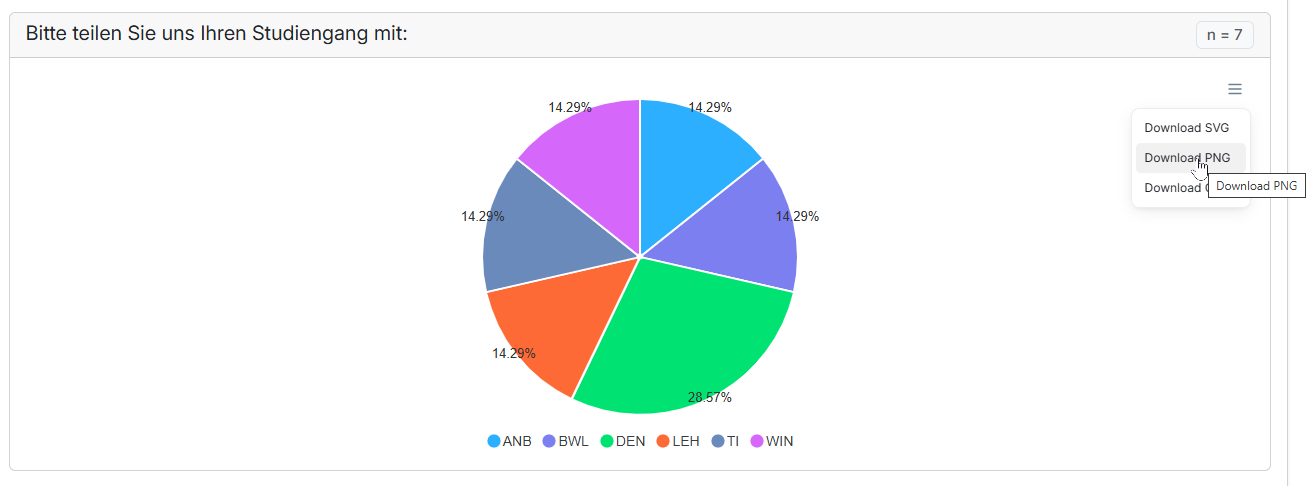
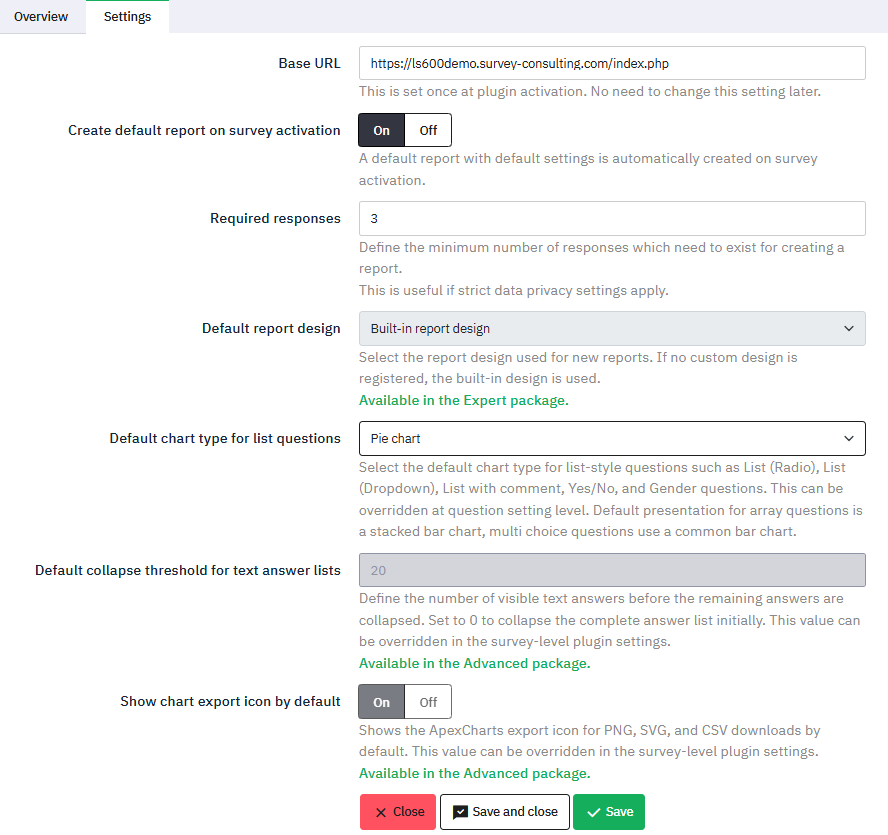
Display supported survey questions using pie, bar, column, and 100% stacked bar charts, depending on the question type and configuration. Set a global default chart type for list-style questions to give your reports a consistent appearance.
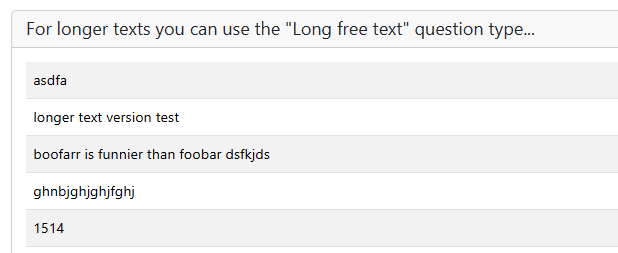
Multiple-choice questions are presented as bar charts, while array questions use stacked bars. Long free-text responses appear as readable answer lists alongside the charts, bringing quantitative results and written feedback together.
Interactive chart tooltips provide percentages and response counts. Collapsible question groups help readers navigate longer surveys, and a fullscreen control provides more space for viewing the report.
Flexible report creation and management
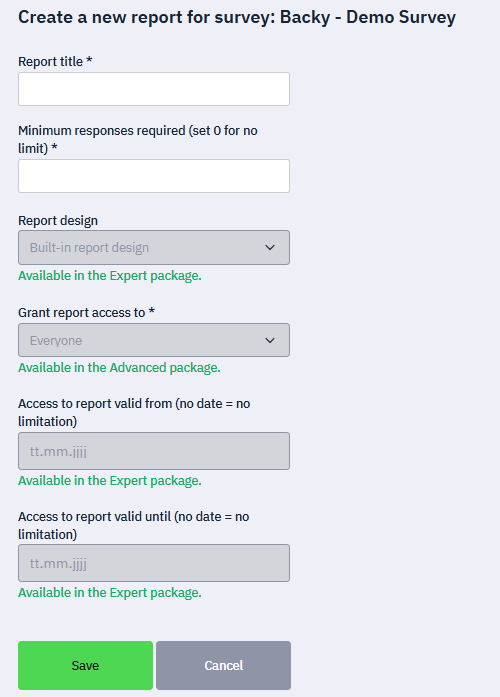
Automatically create a default report when you activate a survey, or create reports manually through the built-in administration interface.
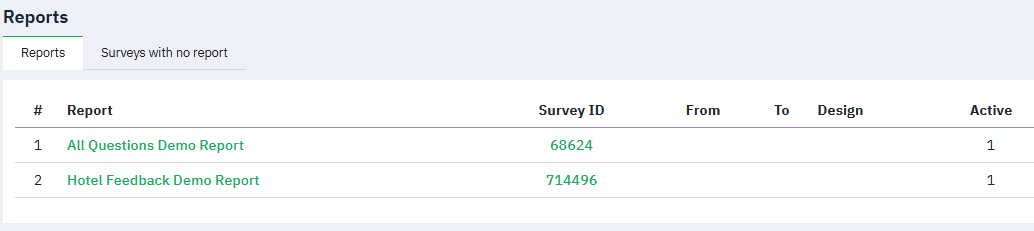
Edit report titles, activate or deactivate reports, and delete reports you no longer need. Manage reports centrally or from the relevant survey’s report list.
Include or exclude individual questions through their question settings to focus each report on the results you want to share.
Choose when results become available
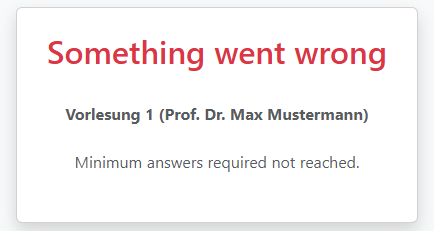
Set a minimum number of completed responses before a report displays its results. This lets you wait until enough responses have been collected before making the findings available.
Each report has its own public link. Anyone with that link can view the report once it is active and the minimum response threshold has been reached.
Currently Supported Question Types
-
List (Radio)
-
List (Dropdown), including compatible Bootstrap Dropdown and Image Select variants
-
Multiple Choice
-
Array
-
Array (5 point choice)
-
Long Free Text
-
Yes/No
-
5 Point Choice
The tool displays reports in the survey’s base language. Question types outside the Free edition’s supported range are excluded from the report.
Planned advanced features
We are planning future advanced editions to offer more ways to analyse, present, and distribute survey results. Six key areas we are considering are:
- Interactive filtering: Explore selected respondent groups using answer filters and submission-date ranges, and share links to filtered results.
- More question types and numerical summaries: Extend reporting to additional text, numerical, date, and matrix questions, including mean values and response counts where applicable.
- Multilingual reports: Allow readers to switch between available survey languages or open a report in a specific language.
- Printing and chart downloads: Add report printing and chart exports in PNG, SVG, and CSV formats.
- Controlled report access: Introduce administrator-only or token-based access and configurable report availability periods.
- Automated report-link emails: Send report links to selected recipients when reports are created, on a specified date, or when a survey expires.
These features are not included in the current Free edition. The final scope and availability of future editions are yet to be confirmed.
Requirements & Sponsorship
-
The plugin requires LimeSurvey 6.x, PHP 8.3 or newer, and an active survey with a response table.
- Installation: First upload the plugin ZIP through LimeSurvey’s Plugin Manager, then activate it and enable reporting for the relevant surveys. Lastly configure your reporting defaults, then create and share your first report.
-
Sponsored by: Hochschule Albstadt-Sigmaringen
Need a report tailored to your organisation?
This plugin is a general-purpose reporting tool designed for common survey reporting needs. If your organisation requires additional features or specialised reports, we are happy to develop them on request.
From custom calculations and visualisations to branded layouts and reports built around a specific evaluation process, we can adapt the solution to your requirements. Contact us to discuss your project.
BTW, you can download more LimeSurvey plugins here: LimeSurvey Plugins Overview
![LimeSurvey SAML plugin [Digital]](https://survey-consulting.com/wp-content/uploads/backend-sso-plugin-300x300.png)
![IP Range Login LimeSurvey Plugin [Digital]](https://survey-consulting.com/wp-content/uploads/backend-ip-range-login-checker-1-300x300.png)

![LimeSurvey NPS Plugin [Digital]](https://survey-consulting.com/wp-content/uploads/Limesurvey_NPS_Plugin-300x300.png)